
Global outsourcing of ADME/DMPK studies to contract research organisations (CROs) is commonplace throughout drug discovery projects. However, the numbers generated from the same in vitro assays from different CROs aren’t always comparable. The physiochemical properties of the compounds themselves can also cause challenges in producing and interpreting data, and if multiple CROs are used, assay methodologies can vary impacting the results. In this blog post, we look at some of the most common challenges in obtaining robust and reproducible in vitro data, focussing on solubility, hepatocyte stability and cell-based permeability assays as key examples.
Solubility
Arguably, a solubility assay should be one of the first in every screening cascade. Whilst not technically a DMPK assay, not having sufficient compound solubility could be misleading not only for results from DMPK assays, but also for any biological and toxicological in vitro assays.
There are several different ways of assessing solubility, but in general two types are most often employed in discovery DMPK:
- Moderate-high throughput turbidimetric and kinetic methods in buffer at pH7.4 are the most commonly used early in drug discovery. Typically, they start with a dimethyl sulfoxide (DMSO) stock, meaning they use little solid compound at a time when very limited material may be available.
- Thermodynamic Solubility assays, which use solid compound and dissolve in buffer without DMSO or solvent.
Whilst the results from the turbidimetric/kinetic methods aren’t comparable with those from the thermodynamic solubility assays, they are informative in the early stages of the projects, especially as all in vitro DMPK and pharmacology/toxicology assays tend to use a DMSO stock solution.
Whether to progress compounds with poor solubility to the next stages of a screening cascade can be decided on a case-by-case basis. However, if a project compound has solubility < 5 µM in a kinetic/turbidimetric solubility assay (with up to 5% DMSO, in some cases), the chances of obtaining robust data from other assays are slim, especially taking into consideration that most assays have <1% DMSO or organic solvent, and the media may be protein-free.
An example of how poor solubility can affect DMPK data is demonstrated in Figure 1, which highlights the impact on data from a metabolic stability assay.
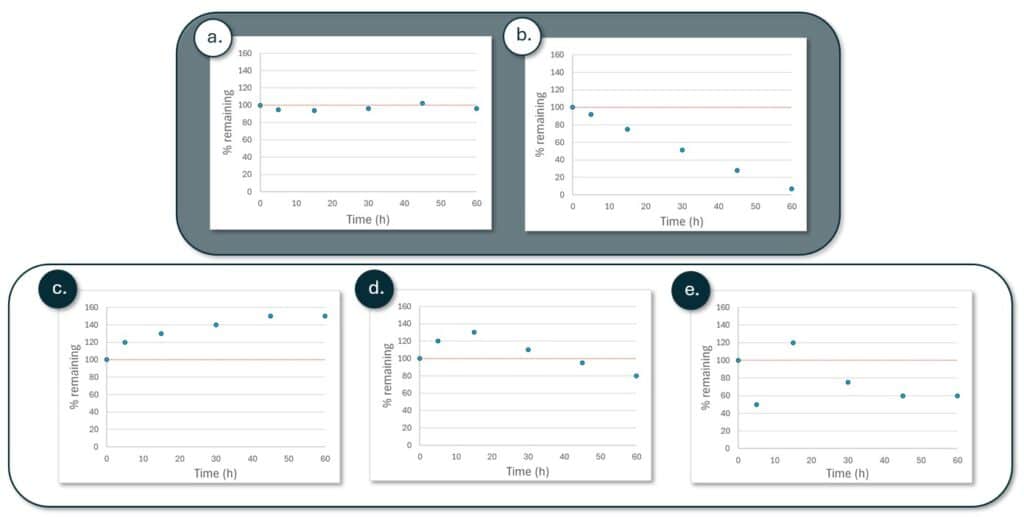
Figure 1. Representations of typical % remaining over time profiles in metabolic stability assays for poorly soluble compounds. Orange line denotes 100% remaining. (a) Typical concentration-time profile for a soluble, stable, compound. (b) Typical concentration-time profile for an unstable, soluble, compound. (c) Compound levels appear to increase over time as the compound goes into solution. (d) Compound levels appear to increase initially as the compound goes into solution, before decreasing as the compound is cleared metabolically. (e) Compound levels are variable over the time course. This is likely caused by precipitated compound being sampled at some time points.
In all cases, other than (a) and (b), in Figure 1, an accurate determination of intrinsic clearance cannot be made as the gradient of the slope, which is usually used to determine half-life and intrinsic clearance, is confounded by the dissolution/solubilisation of the compound during some, or all, of the measured time points.
Metabolic Stability – Hepatocytes
With a 2010 study reporting that hepatic cytochrome P450 (CYP) mediated metabolism is responsible for the clearance of 60% of all marketed drugs1, it is no surprise that in vitro assays to assess liver metabolism are key part of many DMPK screening cascades. Cryopreserved primary hepatocytes are one of the most popular systems in in vitro metabolism assessment as they retain a range of metabolic and transporter functionalities2. However, methods of hepatic metabolic stability assessment can vary widely between labs leading to different results for the same compound.
The extent of these potential protocol differences was emphasized in a review of literature data by Louisse et al (2020) which highlighted differences in the source of hepatocytes, the media used, plate shaking, CO2 levels and cell density. Given the range of conditions, it is perhaps not a surprise that the range of intrinsic clearance values obtained for the same compounds in different assay set‑ups was wide-ranging, often with a %CV over 100% 3.
Shaking, in particular, has been shown to affect the values generated. In a study by Wood et al (2018), intrinsic clearance could be up to 5 x higher when incubations were shaken rather than static. They also showed how substrate concentration was crucial for some compounds with a 10x fold decrease in the substrate concentration for propranolol in human hepatocytes leading to a 2-fold increase in intrinsic clearance, but no difference was observed for midazolam4.
Given that values from these assays are often used when predicting in vivo clearance from in vitro data and making human dose predictions, it is important to ensure that quality data is inputted into predictions, and to be cautious when comparing values for compounds generated in different labs where assay conditions are likely to be diverse.
DMPK scientists also use the terms ‘CLint’ and ‘Clearance’ to describe a number of different parameters, sometimes corrected for incubational binding, sometimes scaled and sometimes predicted using models. When values have been generated in different labs, it is important to know what number/units have been used and ensure that one is comparing like with like.
Cell-Based Permeability
Cell-based permeability models, such as Caco-2 (a human derived colon carcinoma cell-line) are also commonplace in DMPK screening cascades to assess compound permeability and potential transporter interactions as well as to predict potential intestinal absorption in vivo, a crucial factor for an orally dosed drug. The differences with this assay start with the reported units of apparent permeability (Papp), with some providers reporting in nm/s, whereas others use x 10-6 cm/s (and there is a 10-fold difference between them). This can be confusing, especially when using databases where units can be difficult to see on the first glance.
Not only are the reporting units different, but there are also well reported lab-to-lab differences in results from these assays influenced by both cell culture and assay protocols5,6,7.
The literature review by Lee et al (2017) highlights this, with antipyrine Papp varying 12.5‑fold between five literature reports (12 to 150 x 10-6 cm/s) and ranitidine varying 5.3‑fold (0.47 to 2.51 x 10⁻⁶ cm/s)7, which in this case would also change whether the compound was classified as a low or moderate permeability compound.
It is noteworthy that poorly soluble and lipophilic compounds can be especially challenging in Caco-2 assays due to the absence/low levels of protein often used in these assays, and a high surface area of plastic-ware. However, there are assay protocol changes that can be applied to improve the chance of getting robust data for these types of compounds in Caco-2 assays.
So, how can we make sense of our DMPK data if it can be so variable?
As most DMPK screening is now outsourced to a variety of global contract research organisations, it is critical to understand the potential lab-to-lab variability in data generated when reviewing compounds.
The easiest way is by making sure that one only compares results from data generated in the same assay by the same provider, but of course that isn’t always possible. If it is necessary to change assay set-up or data provider, running a tool set of compounds with a range of values can allow a good idea of what any potential differences may look like.
Ideally, DMPK assay protocols from CRO providers should be first reviewed to ensure that best practices are used, giving confidence that the subsequent data generated is both reproducible and accurate.
Obtaining robust in vitro DMPK data is crucial in any effective screening cascade – and understanding the effect of properties such as solubility on data generated is important in effective decision making.
Drug Discovery Solutions is a DMPK consultancy company based in Loughborough, UK. We offer DMPK support to a range of clients including in vitro assay protocol review, study design and data review, pharmacokinetic (PK) modelling and simulation and human PK parameter and dose prediction to projects at various stages of the drug discovery process. Click here to learn more about the services we offer, or click here to contact us to discuss how we can help your project.
References
1 Lecluyse and Alexande (2010) Isolation and Culture of Primary Hepatocytes from Resected Human Liver Tissue. In: Maurel, P. (eds) Hepatocytes. Methods in Molecular Biology, vol 640. Humana Press. https://doi.org/10.1007/978-1-60761-688-7_3
2 Chiba et al (2009) Prediction of Hepatic Clearance in Human From In Vitro Data for Successful Drug Development. APPS. 11 (2) pp. 262 – 276. https://doi.org/10.1208/s12248-009-9103-6
3 Louisse et al (2020) Towards harmonization of test methods for in vitro hepatic clearance studies. Toxicology in vitro. 63, 104722. https://doi.org/10.1016/j.tiv.2019.104722
4 Wood et al (2018) Importance of the Unstirred Water Layer and Hepatocyte Membrane Integrity In Vitro for Quantification of Intrinsic Metabolic Clearance. Drug Metabolism and Disposition. 46 (3) pp. 268-278. https://doi.org/10.1124/dmd.117.078949
5 Volpe (2008) Variability in Caco-2 and MDCK Cell-Based Intestinal Permeability Assays. J Pharm Sci. 97 (2), pp. 712-725. https://doi.org/10.1002/jps.21010
6 Kus et al (2023) Caco-2 Cell Line Standardization with Pharmaceutical Requirements and In Vitro Model Suitability for Permeability Assays. Pharmaceutics. 15, 2523. https://doi.org/10.3390/pharmaceutics15112523
7 Lee et al (2017) Quantitative analysis of lab-to-lab variability in Caco-2 permeability assays. Eur J Pharmaceutics and Biopharmaceutics. 114, pp. 38-42. https://doi.org/10.1016/j.ejpb.2016.12.027